More on the NC Teacher Turnover Report by the Media – #NCED #NCGA

Yesterday, Lt. Governor Dan Forest released a video highlighting important information Narrative keanuwhich the media in North Carolina has been remiss in reporting on.

The media mantra has been along the lines that teachers are leaving in droves to teach out-of-state and subsequent commentary about teacher pay.

What the media has failed to report is that this report includes teachers who retired, changed jobs within education in our state and those who were dismissed.

A good example of this media spin is the fantastical comparison used recently by WUNC:

“It shows 1,082 of the state’s teachers left for classrooms in other parts of the country last year. That’s more than triple the number that left for other states in 2010.”

That looks dramatic, doesn’t it? Yes, that exit number has gone up each year over the few years. So has the number of teachers remaining in the state.

First remember, there were 96,651 teachers in North Carolina in 2010, and the current report has a teacher population of  96,081. That’s a population difference of 570 less in the current year’s report.

The number leaving to teach out-of-state in 2010-11 was 312.  But what WUNC doesn’t include is that in 2010, 1,522 stayed in North Carolina to teach in another school.

In the 2014-15 report, the number leaving for out-of-state  is indeed 1,082, however the number staying in North Carolina to teach in another school is 4,492. That’s nearly triple the rate of teachers staying in 2010.

Watch the video:

Key take-aways:

  • The true turnover rate is not 14.8%, but 6.8%.
  • Of that media reported 14.8%, 4.7% “left” to teach in another North Carolina school.
  • 2.3% retired with full benefits, meaning they were of age or had enough time in the system to do so.
  • 1% did not have contracts renewed.
  • Only 1,028 teachers actually left to teach in other states. That’s out of over 96,000 teachers, or around 1%.
  • The video cites the NEA’s own statistics, which says that North Carolina is far below the average national teacher turnover rate.
  • The Lt. Governor also addresses the narrative that teachers are leaving for Texas. Teachers in the state of Texas are leaving at a rate of 19%.

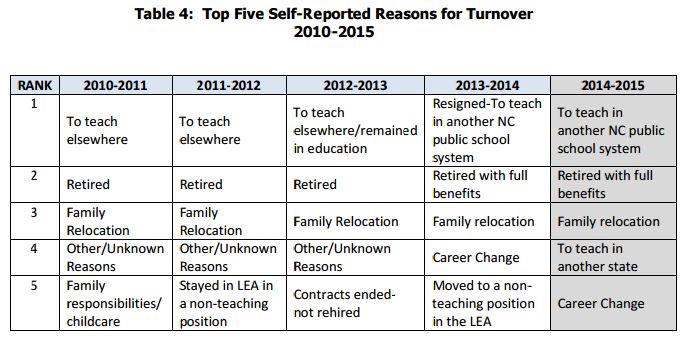
What the video doesn’t mention is that leaving to teach in another state wasn’t even in the top 5 reasons for 2014-15, nor was it in the top five for the previous school year.

In fact, looking over the last decade’s worth of turnover reports, it would appear that leaving to teach in another state has not been a top reason and as a percentage this reason has remained at or below 1%, just like this year.

It is worth noting that DPI reclassified ‘leaving to teach in another state’ from the “Turnover but remained in education” category  to the “Turnover for Personal Reasons” category as of their 2012-13 turnover report.

It will be interesting to see the 2015-16 report, given that the legislature kept their promise and have increased entry pay from $33k to $35k, reinstated the step-pay schedules that the democrats and Governor Perdue froze during her tenure.

In addition, the legislature increased the education budget again, this time by $350 million and also created a tax deduction for teachers they can take advantage of when buying supplies.


Related Reading:

Posted in A.P. Dillon (LL1885), EDUCATION, Media Bias, NC DPI | Tagged | 5 Comments

NC’s Version Of Bill Gates Is Backing Jeb ‘Common Core’ Bush. SHOCKER. – #ncpol

File this one under, “well, duh”.

BizJournals is reporting that SAS’s Jim Goodnight, who when it comes to meddling in education is North Carolina’s version of Bill Gates, has dumped a pile of money into Jeb Bush’s campaign.

BizJournals.com:

A $196,800 donation puts SAS Institute CEO Jim Goodnight in fifth place as the most generous tech titan thus far in the 2016 election cycle, according to Forbes.
Forbes took a look at technology billionaires and their contributions and found the top five were Larry Ellison (Oracle) with $3 million, Phillip Ragon(Intersystems) with $410,000, H. Ross Perot Jr. (Perot Systems) with $272,000,Steve Ballmer (Microsoft) with $252,700 and Goodnight.
A deeper look shows that the agency Goodnight is primarily supporting, Right to Rise, supports Jeb Bush’s campaign for president. It has spent more than $9 million in federal elections for the 2016 cycle, according to the Center for Responsive Politics.
Goodnight pledged $100,000 to that organization in March, according to the Center’s donor search. Goodnight also pledged $25,000 to the pro-Scott Walker PAC and $5,000 to the Victory & Freedom PAC, affiliated with U.S. Rep. Virginia Foxx. He, as well as his wife, Ann, pledged additional donations to the Republican National Committee in April.

Sorry, but all the money from every fat cat in the country will not buy Jeb the nomination.

Jeb Common CoreThe Goodnight’s have invested a ton of money into “education non-profits” like BEST NC and the corresponding news outlet PR firm Education NC.

It’s their way of driving the direction of education in our state by circumventing the public and going right to politicians,  just like Bill Gates.  It also helps them plan for grabbing their share of the education spending windfall. Convenient.

Fun fact: SAS has been a big proponent of Common Core, yet their own school, Cary Academy, doesn’t use it. It’s just fine for us peasants, though.


Related Reading

Posted in A.P. Dillon (LL1885), EDUCATION, ELECTIONS | Tagged , | 3 Comments

#DM7 Article: The ‘Women’s Healthcare’ Mask Falls at Planned Parenthood Hearing

This is a repost of my weekly column at Da Tech Guy:

The ‘Women’s Healthcare’ Mask Falls at Planned Parenthood Hearing


By A.P. Dillon

Yesterday at a House Oversight and Government Reform Committee hearing, the Planned Parenthood mask of ‘women’s healthcare’ fell.

Hearing Key Points & Other Relevant Information

Despite NY Democrat Rep. Carolyn Maloney’s attempt to rescue Planned Parenthood’s Cecile Richards during the proceedings, it was made clear that the group does not do mammograms. Richards herself stated that to “the best of her knowledge” that none of the Planned Parenthood facilities even had a mammogram machine. (Free Beacon)

When questioned on making statements that Planned Parenthood did indeed do mammograms, Ceclie Richards stated, “we’ve never stated that we did”. Well, yes, they did say that they did mammograms. In fact, Richards said it herself in a 2011 interview. (Weekly Standard)

According to the Planned Parenthood annual report, 327,653 abortions were done in 2013 alone. (Free Beacon)

Of those 327,653 abortions, 36% were black babies according to the CDC. That’s apparently 1,000 times more than blacks killed by law enforcement.  (SooperMexican)

Richards was asked about the Center For Medical Progress (CMP) videos exposing monetary gain through the illegal trafficking of human organs labeled by Planned Parenthood as ’tissue donations’.  Richards said the videos were “deceptively edited” and “heavily doctored.” Her statements seem to imply she’s seen some or all of the videos.
However, just before Richards’ testimony, evidence was provided by a digital security and forensics firm called Coalfire that the full length CMP videos were “authentic and have not been manipulated”. (Daily Signal)

Abortions make up 86% of revenue for Planned Parenthood. Only 3% of their revenue comes from other services. (Twitchy)

There was the revelation of “exorbitant travel expenses,” incurred by Planned Parenthood. Included in the “exorbitant” list was $622,706 for “blowout parties” with celebrity guests. Also included was $34.8 million for its NYC corporate office space and the sale of a 72k square foot condo “to Brookfield Property Partners for $69.6 million.”. (The Hill)

The question is raised yet again, why does Planned Parenthood need taxpayer dollars if “Planned Parenthood gets about $700B in nongovernmental funds…”? (Hot Air)

Richards is paid over $500,000 a year. She got a big raise of $240,000 in 2013. Rep. Chaffetz’s documentation showed Richards making $590,000. Richards argued she only makes $520,000. Poor baby.  Apparently, Richards also received $31,000 from  allocated time to the Planned Parenthood Action Fund.”  (The Blaze)

Planned Parenthood’s Blood Money Goes To Democrat Defenses

Legal Insurrection noted from the hearing testimony that Planned Parenthood raised $127 million above its expenditures last year.

The question then becomes, what does Planned Parenthood do with their overage?

The answer is, they give it to Democrats or spend it attacking Democrat opponents.

Legal Insurrection also notes:

Outside of abortions, Planned Parenthood’s primary function is filtering money to and from Democratic organizations, giving in excess of $574,000 to candidates seeking federal office alone.


The Planned Parenthood Action fund has spent over $74,000 in 2015 – on attacking Clinton opponents. Dark Money, anyone?

Planned Parenthood’s Action fund ranks 22 in the list of top political non-profit spending. The Action Fund’s total spending reported to the IRS is $42,192,016. Of that, $8,250,439 was political spending. Only $6,634,390 was reported to the FEC.

A valid question to be posed to Democrats now is, are our children “just a matter of line items” in their campaign finance reports?

DM7 small LL1885A.P. Dillon resides in the Triangle area of North Carolina and is the founder of LadyLiberty1885.com.
Her current and past writing can also be found at IJ Review, StopCommonCoreNC.org, Heartland.org and Watchdog Wire NC.
Catch her on Twitter: @LadyLiberty1885

Posted in A.P. Dillon (LL1885) | Tagged , | Comments Off on #DM7 Article: The ‘Women’s Healthcare’ Mask Falls at Planned Parenthood Hearing

‘All Time High’ Teacher Turnover Narratives Return – #nced #ncga

The narrative that North Carolina teacher turnover rates are at an ‘all time high’ has returned.

WRAL wins the title of misleading lede of the week:

The fact is that teacher turnover barely ticked up from last year.

Department of Public Instruction’s (DPI) press release:

“In 2014-15, 14,255 teachers left their local school districts resulting in an overall state turnover rate of 14.84 percent. This percentage is slightly up from the 14.12 percent reported in 2013-14.”

Gee, a whole .72 increase. 

Since the adoption and implementation of Common Core, the rates have risen. This is, of course, is not a reason listed by DPI.

From the report, emphasis added:

1. Generally, teachers are remaining in the classroom in North Carolina. The overall state attrition rate for 2014-2015 is 14.84%. Last year (2013-2014), it was reported at 14.12%, which represents a less than 1% increase in the state’s overall turnover rate.

Also from the press release:

State Superintendent June Atkinson expressed concern over the report’s findings saying, “In the past five years, the state’s teacher turnover rate has increased in all but one year (2013-14). We won’t reverse this trend until we address the root causes of why teachers leave the classroom.”

Root causes? Did she not read DPI’s own report? Perhaps not, seeing as it doesn’t appear to be very complete.

Oh wait, Atkinson’s statement supposed to be a  ‘wink-wink, nudge-nudge’ moment hinting something about teacher pay? Probably.

More from the report, emphasis added:

There are 28 reasons LEAs use to code their attrition data. For purposes of this report, the self-reported reasons teachers leave have been categorized into five summary categories. As reflected in the chart on page 6, teachers reported “personal reasons” as the main reason for their decision to leave the profession this year (2014-2015). “Personal reasons” includes individuals retiring with reduced benefits, individuals resigning to teach in another state, individuals dissatisfied with teaching, and family relocation. Family relocation was largely the reason most reported in this category this year (a total of 1,547 teachers). Over the past three years (2012-2013, 2013-2014, and 2014-2015), over 30% of teachers were reported as “turnover but remained in education,” which means they remained in the profession (teaching), however, have shifted from LEA to LEA within the state, teaching in public charter schools or moving to non-teaching positions in education (administrative roles, coaches, instructional facilitators, etc.).

View the chart on page 6, Turnover Reasons by Categories 2014-2015, as the above excerpt mentions.

The narrative that teachers are leaving for higher pay in other states just doesn’t hold water. This year’s report lists 1,028 teachers leaving for teaching in other states… out of the total 14,255 in the turnover report.

Of note are the number of teachers retiring with full benefits which the report puts at 1,755.  Those retiring with reduced benefits was only 479.

Meanwhile, 982 were dismissed for one reason or another.

What’s also interesting in this turnover report  is what a colossal waste of NC taxpayer millions Teach For America seems to be:

Out of 139 Teach for America (TFA) Teachers employed in 2014-2015, 42 did not remain in the classroom (an approximate 0.04% loss of the total educator workforce). 25.09% of teachers reported were categorized as VIF teachers and 141 left the teaching profession.

Highest and Lowest Districts
According to the DPI report, the highest turnover was in Northampton County. Northampton is a relatively small county where, by last count in 2013, the population is somewhere just north of 20,000 people.

The average teacher salary supplement in Northampton for 2014-15 was only $1,225, which is less than 1/6 of the highest supplement which was Chapel Hill Carrboro Schools at $6,892.  Chapel-Hill Carrborro isn’t that big either and, as of 2013, had a comparable population number as Northampton.

Washington County schools was second behind Northampton. This is another small county with a population below 13,000 people. Their salary supplement was only $661.

Bertie County schools had the third highest turnover. Bertie is another small county and their supplement pay was only $780.

Rounding out the top five were Warren and Halifax. Both small counties again and both with miserably low supplemental pay.

Halifax has the distinction of having an average of $0 as their supplement. I’m surprised they aren’t number one in turnover. In fact, in 2014-15, Halifax was one of seven districts not offering a supplement, which is set by local school boards not the legislature.

However, it’s worth pointing out that some of the low turnover districts also had poor supplemental rates. The low turnover districts, overall, had larger teacher populations than the high turnover districts.

Knowing why teachers moved from one district to another would be useful, but that data isn’t included.

Given the similarities I’ve laid out and taking into consideration the increases over the last few years made by the legislature (step pay unfrozen, bonuses, increased entry pay), one has to ask,  is teacher pay really still a ‘root cause’ for turnover?

Since 2012-13, that doesn’t seem to be the case:

2010-15 turnover top 5


RELATED READING:
Senate Bill 333 – Teacher Attrition Data (passed into law in 2015)

Posted in EDUCATION, June Atkinson, NC DPI | Tagged , | 4 Comments

Gates Backed Hope Street Group Push Agenda Using Wake Taxpayer Resources

Below is an email sent to me by a teacher unamused at the Bill Gates backed ‘education non-profit’ using Wake county official email to push their non-profit’s agenda items.

Gee, sounds familiar.

From: “Angie Scioli” <noreply@wcpss.net>
Date: 10/02/2015 12:20PM
Subject: Wake teachers seek your input on ed policy

Hi Fellow Wake County Teachers,

We are inviting you to join us in an effort to give teachers a voice in educational policymaking in North Carolina.  A national nonpartisan, nonprofit group, the Hope Street Group, in partnership with the NC Department of Public Instruction and State Board of Education, is gathering input from North Carolina classroom teachers.

Thirty statewide Hope Street Teacher Voice Network Fellows are leading focus groups and launching surveys to craft a plan of action to further support N.C. teachers.  We are the three Fellows from Wake County, and are asking for your help and participation in building a collective voice to encourage positive change in N.C. school systems.  

Join our professional learning network via this Google form to receive policy updates and teacher leadership opportunities.  

When you do, you will receive the fall policy survey (brief, 15 questions) and information about upcoming focus groups.  Collected data will be analyzed and full reports will be shared with the State Board.  It is the stated goal of this partnership that the State Board will take action on 70% of the recommendations that come from the report.  Data from the reports will also form the basis for talking points we use as we build relationships with members of the General Assembly.  We will conduct a second “wave” of data collection this spring.  

When you get the survey link, please share it far and wide.  We have a goal to gather input from 10% of NC teachers this round, and 25% next year.  

Join our network to help us raise teacher professionalism and ultimately enhance North Carolina students’ educational experience.

We look forward to hearing from you!

Akinyi Edmonds, Heritage Middle School
Trey Ferguson, Leesville Road High School
Angie Scioli, Leesville Road High School

NC Teacher Voice Fellows


Gee,  using tax payer resources to promote Hope Street Group activities, including collecting teacher emails for their distribution purposes.

I don’t give a good God damn if they are ‘partners’ with DPI or not, this is NOT an appropriate use of a resource the taxpayer funds. Bill Gates has given them piles of money, use your own damn email.

Why is this group needed to get input from North Carolina teachers? Isn’t that DPI’s job?

This ‘partnership’ represents yet another thing that DPI, under the direction of Superintendent Atkinson, has farmed out to a ‘non-profit’ funded by big business.

Bill Gates Dead CatUnfamiliar with Hope Street Group and the ‘Teacher Voice Network’ charade? Read on.

“national nonpartisan, nonprofit group, the Hope Street Group”

YEAH, right!

They’re a Common Core propaganda group running around various states trying to recruit teachers to ‘turn the tide’ on public opinion of the standards.

They pull in other teachers by saying they are really trying to affect  broader policies. That’s total crap.  Go check out their Arne Duncan approved  The Teacher Common Core Playbook.

Read my series on them:

Now that you’re caught up on Hope Street Group, do you remember Angela Scioli of protest group, Red4EdNC?    I’ve mentioned her here on the blog a few times.

She showed up at the Common Core Commission as ‘just a mom’ touting the wonders of Common Core math.

Scioli’s also the teacher who can’t go to the grocery store on over $60k a year and was featured in that ridiculous Op-Ed by the millionaire social justice warrior and all around leftist, Gene Nichol.

With all this activity of Scioli’s, when does she teach?


Posted in A.P. Dillon (LL1885), Common Core, EDUCATION | Tagged , | 7 Comments

Wallet Hub Ranking More of a Wallet Flub

As I mentioned in an earlier article, ‘Wallet Hub’ has produced its second education related ranking list.  The first Wallet Hub ranking list came out last year and was full of holes, this one is no different.

Terry Stoops at John Locke has an opening first shot at this ‘ranking’ list.  Here’s an excerpt with emphasis added, but go read the whole thing:

“The first six data points are used to determine the “Job Opportunity & Competition” portion.  The next seven are used for the “Academic & Work Environment” portion.  North Carolina ranked 50th on the former and 34th on the latter, which combined magically to produced an overall rank of 50 out of 50 states and the District of Columbia.  (The decision to compare states to a city is a curious one.)

But it is pretty apparent that North Carolina fares reasonably well on most indicators, considering that a number of recent efforts to raise teacher pay are not represented in the data used (because data collection understandably lags).  The most interesting aspect of the ranking is that North Carolina earned a rank of 50 out of 51 despite that fact that only two of the 13 indicators come anywhere close to the bottom.

Yeah, using that Common Core math are we, Wallet Hub?

Here’s the first line item of the data sent to me:

STATE Average Starting Salary for Teachers
(adjusted for cost of living)

North Carolina Results: $31,894
North Carolina Ranks: 40
Sources: National Education Association Years 2012-2013 & 2014

I can tell you that this first line item is probably wrong just based on the outdated sources used. Some went back to 2011. All listed were just the source such as Census or NEA, but no link to the actual data set they used.  That’s, um, really helpful.

For example, for the above first line item, Wallet hub cited the ‘NEA for 2012-13 and 2014’.

The NEA has a 2012-13 starting teacher salary ranking chart showing $30,778 as the starting salary that year. But the NEA’s 2014 average starting salary chart isn’t out yet.

So what was Wallet Hub referring to when they cite NEA 2014? Were they using portions of the NEA’s ‘2014 Ranking and 2015 Estimates‘?  We have no idea. They didn’t tell me or link to the source document as I requested.

Why not use the actual number of $33,000 directly from the North Carolina Department of Public Instruction’s 2014-15 salary guide?  Too easy?

Also remember, that $33,000 isn’t the final compensation. Each district is responsible for adding supplemental pay to these salaries.

Conveniently for the ‘war on education’ narrative Superintendent Atkinson keeps trying to drive, DPI no longer publishes the supplemental salary schedules. That’s ok though, I took the data sets they directed me to and made one. Converting it to a PDF made it fuzzy, email me if you want a cleaner spreadsheet version.

TommyLee ReallyWallet Hub didn’t include their ‘cost of living’ formula when I asked, but they did communicate to me that to calculate cost of living they, “consulted the cost of living index here: https://www.coli.org/ via the Council for Community and Economic Research.

So, I went to the site.

You can only get state by state comparison data if you pay for it.  The only tool open for general use is city by city comparison.

It is unknown if Wallet Hub used city by city or state by state since their methodology used was as vague as one can imagine. If they used the city by city one, then the number they came out with is frankly useless in a ‘state ranking’ scenario.

Old data, vague data sources, no idea what formula’s they used for anything  – one has to conclude this ‘Best and Worst’ list has about the same integrity as a drinking straw being used for indoor plumbing.

Wallet Hub? Try Wallet Flub.


Posted in A.P. Dillon (LL1885), EDUCATION | Tagged | 3 Comments