Following the revelations in Broward County Public Schools following the Valentines Day shooting, all eyes should be on the recently released NC Dept. of Public Instruction (NC DPI) annual school crime report.
It’s still a draft right now, but it likely won’t change much.
I’ve included some of the highlights from the draft report below.
As you read these and the rest of the report, bear in mind what has come to light regarding the Parkland shooting. It’s been learned that the district, under Obama era guidelines, neutered school discipline efforts and law enforcement arrests in order to lower suspension rates of minority students – regardless of the crimes or infractions committed.
Similar programs were instituted in North Carolina. I’ve been tracking the so-called “school to prison pipeline” and I wrote about it last week with a focus onWake County Public Schools.
Charter schools are included near the bottom third of the report; the level of short-term suspensions compared to their traditional counterparts is low. There were no expulsions and very few long-term suspensions.
We’ll start with “reportable crimes.” The report does not define what a reportable crime is or isn’t.
It does list 16 types of ‘crimes’ but does not include crimes where a teacher has been charged with sexual contact or similar crimes against students. There is no report for that to my knowledge.
There are nine dangerous and violent acts:
• Homicide
• Assault resulting in serious bodily injury
• Assault involving the use of a weapon
• Rape
• Sexual offense
• Sexual assault
• Kidnapping
• Robbery with a dangerous weapon
• Taking indecent liberties with a minor
The other seven acts are:
• Assault on school personnel
• Bomb Threat
• Burning of a school building
• Possession of alcoholic beverage
• Possession of controlled substance in violation of law
• Possession of a firearm or powerful explosive
• Possession of a weapon
Now, what kind of numbers are we talking about with these crimes?
According to the draft report, violent crimes increased in 2016-17 over the previous year. The increase, both numerical and percentage-wise, is in parentheses.
• Assault on school personnel (102, 7.7%)
• Assault resulting in serious injury (36, 124.1%)
• Sexual offense (31, 193.8%)
• Sexual assault (25, 30.5%)
• Bomb threat (20, 29.0%)
• Assault involving use of a weapon (9, 23.1%)
• Burning of a school building (7, 87.5%)
• Rape (1, 100%)
• Taking indecent liberties with a minor (1)
Be sure to scroll down through the report itself to see “Table C1. Reported Statewide Acts by School Levels.” There one will find out that there were 1,431 assaults on teachers or school employees in 2016-17.
Further down in the report, the ‘reportable crimes’ are broken down by the school district.
And what dropped between 2015-16 and 2016-17? Possession of drugs, alcohol, and guns were the top three.
• Possession of controlled substance in violation of law (350, 7.5%)
• Possession of an alcoholic beverage (52, 5.6%)
• Possession of a firearm (13, 11.0%)
• Death by other than natural causes (1, 100%)
• Robbery with a dangerous weapon (1, 11.1%%)
• Possession of a weapon excluding firearms and powerful explosives (1, 0.04%)
Here’s what these crimes look like by the numbers:
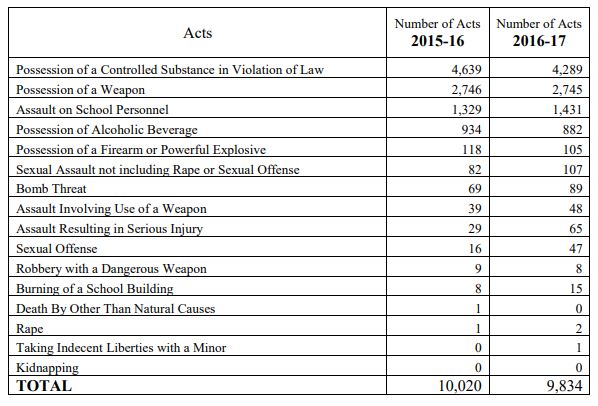
Reportable Crimes
Interestingly, in the reportable crimes section, bringing guns on campus was not one of the top three most reported crimes. It’s also worth noting that black students were still committing more crimes than other ethnicities.
- The number of reportable crimes by high school students decreased by 231 from 2015-16 to 2016-17, a 4.0% decrease. The high school reportable crime rate decreased by 4.9%. There was an overall decrease in reportable crimes for all grades of 186, a decrease of 1.9%. The overall crime rate decrease was 2.1%.
- Reportable crimes were most frequently committed by students who were ninth graders and male. Among ethnic groups in high school, black students had the highest rate of school crimes, followed by American Indian students.
- LEAs reporting zero grade 9-13 reportable crimes were Alleghany County, Graham County, Hyde County, and Jones County. Of the LEAs with more than zero, those with the lowest rates of grade 9-13 reportable crimes were Clinton City, Cherokee County, Pasquotank County, Weldon City, Mitchell County, and Hickory City.
- LEAs with the highest rates of grade 9-13 reportable crimes were Swain County, Avery County, Perquimans County, Durham County, Haywood County, McDowell County, Cleveland County, Alexander County, Madison County, and New Hanover County.
- In 2016-17 LEAs reporting the largest 3-year decreases (reductions compared to 2013-14) in rates of grade 9-13 reportable crimes were Alleghany County, Hickory City, Weldon City, Pasquotank County, and Clinton City. Graham County, Hyde County, and Jones County reported zero high school crimes in both 2013-14 and 2016-17.
- LEAs with the largest 3-year increases in rates of grade 9-13 reportable crimes were Washington County, Tyrrell County, Whiteville City, Madison County, and Mount Airy City. Although Tyrrell County, Whiteville City, and Mount Airy City had large increases, their 2016-17 grade 9-13 crime rates were below the state average.
- The most frequently reported reportable crimes in high school were 1) possession of a controlled substance in violation of the law, 2) possession of a weapon excluding firearms and powerful explosives, and 3) possession of an alcoholic beverage.
Alternative Schools and Programs/Expulsions/Suspensions
The following section would likely include the SCORE program used in Wake County.
Over 18,000 students had to be moved to an ‘alternative school’ or places into an ‘alternative program’.
The report describes alternative learning programs as “services for students at risk of truancy, academic failure, behavior problems, and/or dropping out of school. These services should be designed to better meet the needs of students who have not been successful in the regular public school setting.”
Translated: These kids committed an offense that they should have received a long-term, out of school suspension for but were instead put into one of these schools or programs to keep the suspension stats down.
- Alternative schools and programs (ALPs) reported 13,397 student placements in 2016-17, a 4.3% decrease from 2015-16. There were individual students placed in ALPs during the 2016-17 school year. LEAs made 5,054 assignments
of students to ALPs as disciplinary actions.
Expulsions dropped.
- The number of expulsions decreased 33.3% from 27 in 2015-16 to 18 in 2016-17. High school students received 17 of the 18 expulsions
Long-term suspension instances dropped by 324 or 32.9%. More males (537) were suspended long-term than females(158). Black males and females lead in long-term suspension rates as well.
- The number of long-term suspensions (11 or more days) for all students declined 32.9% from 1,036 in 2015-16 to 695 in 2016-17.
- Average school days per suspension decreased from 76.6 to 73.9 school days.
- High school students received 458 long-term suspensions, a 34.8% decrease from 2015-16.
Short-term suspensions were ridiculous. According to the summary at the end of the draft report, 83,300 students across grades 9-13 has short-term suspensions in 2016-17. This is a decrease (5.9%) from the 2015-16 total of 88,559.
Now chew on this – one out of every 13 kids in NC public schools had at least 1 short-term suspension in 2016-17. If you limit the view to only high school students, the number is one in ten.
- The number of short-term suspensions for male students in 2016-17 was 2.77 times higher than for females.
- Males received 153,228 short-term suspensions (ten days or less) in 2016-17, a 3.7% decrease from the previous year.
- Females received 55,295 short-term suspensions, a 4.1% decrease
- Top short-term suspensions by race: Black 118,398, White 52,985, Hispanic 21,716.


Pingback: Students ‘Walked Out’ As NC School Threats Continue | LL1885
Pingback: ICYMI – Three More School Threats In NC Last Week | LL1885
Pingback: NC Teacher Pay Breaks $50k, Cue The Complaining? | LL1885