
The annual school crime report was published and these are the main highlights, which include an increase in sexual related assaults and assault on school staff.
There was an important notation in this report, which impacts how the data is read and arguably makes shifts in suspension rates look more impressive than they are:
“In previous consolidated reports, the rates for crimes and suspensions were reported using various denominators (i.e., per 10, per 100, per 1000). In this 2018-2019 consolidated report, rates have been standardized across the crime & violence and short-term suspension reports to reflect a rate per 1000 students. Long-term suspension rates are reported per 100,000.”
This change in rate also impacted the number of reported crimes and using a rate of ‘per 1,000 students’, the crime rate appears to be at a five-year low.
The number of total acts reported in the 2018-19 school year dropped by 193 to 9,554. However, using the per 1,000 students accounting, the overall number of acts per student dropped just .19% (from 6.48 to 6.29).
Main Highlights
- The number of reportable crimes on high school campuses decreased by 11% from 2017-2018 to 2018-2019.
- The high school crime rate decreased 9.0%, a significant decrease from the previous year’s decrease of 2%.
- In 2018-2019, there were 23 expulsions in North Carolina schools, an increase of one from the 2017-18 academic year.
- In the 2018-2019 academic year, zero school districts reported the use of corporal punishment. In the 2017-2018 academic year, two districts employed corporal punishment for a total of 60 uses, 15 less than the 75 reported uses in the 2016-2017 academic year.
There are 16 reportable crimes in NC Schools. The first nine acts in the list below are considered “dangerous and violent.”
- Homicide (D)
- Assault resulting in serious bodily injury (AR)
- Assault involving the use of a weapon (AW)
- Rape (R)
- Sexual offense (SO)
- Sexual assault (SA)
- Kidnapping (K)
- Robbery with a dangerous weapon (RW)
- Taking indecent liberties with a minor (IM)
- Assault on school personnel (AP)
- Bomb threat (BT)
- Burning of a school building (BS)
- Possession of alcoholic beverage (PA)
- Possession of a firearm or powerful explosive (PF)
- Possession of a weapon (PW)
The acts above are listed with their assigned “code” next to them for later reference in the report.
In past reports, reportable acts were not differentiated by perpetrator type and acts by teachers against students are not identified or included. This year’s report has some differentiation, with a breakdown of “student” and “other.”

To date, there is no annual crime report for acts perpetrated by staff or educators.
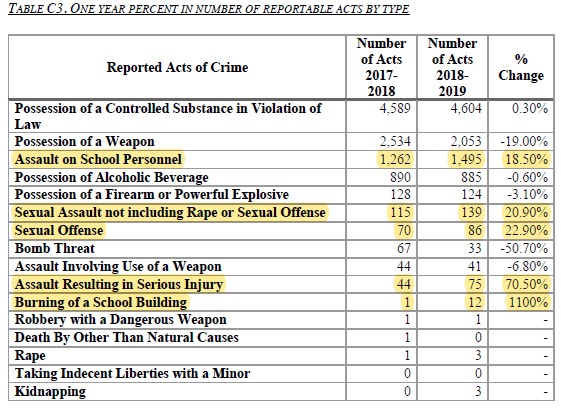
Reportable Crimes with small changes
- 4,604 acts of possession of a controlled substance. This was the largest portion of crimes, at 48% of all reportable crimes. This percentage is almost unchanged from the prior year.
- 2,053 acts of possession of a weapon. This number dropped by just under 20% over the previous year.
- 124 acts of possession of a firearm or powerful explosive. Not a huge change from last year, less than 4%.
Reportable Crimes with big changes
- 1,495 assaults on school personnel. That’s a jump of over 18% over the previous year.
- 139 sexual assaults (not including rape or sexual offense). This is a disturbing increase of 20% over the previous year’s total. What’s even more disturbing is where the bulk of the grade levels they occurred in: HALF of them happened in Prek-8th grade. Prek-5th had 9 and grades 6-8 had 61. High schools had 43 and “other” had 4. (See table C5- statewide acts by school level)
- 86 sexual offenses. This number also sharply jumped by around 23%.
Top Districts for Reportable Crimes
(The Reportable Crime Rate in parenthesis is per 1,000 Average Daily Membership.)
- Charlotte-Mecklenburg Schools – 554 (12.86)
- Wake County Schools – 499 (10.17)
- Guilford County Schools – 367 (16.37)
- Durham Public Schools – 148 (14.39)
Three-year trends in Reportable Crimes
- Three-year decrease in the rate of crime, short-term suspensions, and dropouts: Jackson County, Stokes County, Hickory City, Edenton/Chowan, and Macon County. Each of these LEAs had an average decrease in crime rate, short-term suspensions, and a dropout rate of at least 50%.
- Three-year increase in the rate of crime, short-term suspensions, and dropouts: Avery County, Bertie County, Newton Conover City, Henderson County, Asheboro City, and Swain County.
Highlights of Suspensions:
- 9th graders received the most long term and short term suspensions for the fifth year in a row. They also had the most expulsions with 11 and the second largest number of in-school suspensions behind 7th graders.
- Of the 23 students expelled in 2018-2019, fifteen (65%) were black students, five (21.7%) were white students, and two (8.7%) were Hispanic students.
- Of the 23 students expelled in 2018-2019, six (26%) were students receiving special education services.
Short-term suspensions are defined as a student being out of school for ten days or less. Statewide, these types of suspensions dropped to 203,298 (roughly 3.8%).
Long-term suspensions are where a student is out of school for over ten days. Statewide they dropped 587 or just under 13%.
Since districts have altered their discipline policies or the way they count their suspension, the overall drop in suspensions is arguably artificial and as evidenced by the increase in in-school suspensions over the decade. In addition, “restorative justice” practices are not counted in place of a suspension of any kind.
Suspension rate reporting also includes alternate school assignments:
In 2018-19, North Carolina public schools assigned 238,697 in-school suspensions of a half day or more to 119,323 students. This is a 0.24% increase over the 238,115 in-school suspensions reported in 2017-18. In addition, 28,379 partial day in-school suspensions were assigned to 18,363 students; this is a 3.8% decrease from the 29,494 partial day suspensions assigned in 2017-18.
Here’s the chart that gives a better view of who gets sent to “alternative learning” settings. Note the category of “instead of long-term suspension.”

Overall, black students are still suspended more often for long, short and in-school than other students.
No one at the local, district or state level is asking why that is, if it was warranted or if repeat offenders are being addressed. Nor will they as long as policy changes drop the numbers on paper. Changing discipline policies is the new busing for diversity.
Drop Out Rate
- The North Carolina high school dropout rate for the 2018-2019 academic year
decreased to 2.01% from the 2017-2018 dropout rate of 2.18% in 2017-18. - Over half of LEAs (51.5%) witnessed a decrease in their high school dropout rates from the previous academic year.


You must be logged in to post a comment.