The 2017-18 North Carolina school grades, EOG scores, and other related testing data have been published by the Department of Public Instruction.
The Good: More than a third of NC schools earned A’s and B’s last year.
The Bad: The graduation rate dropped and Read to Achieve results dropped.
The Ugly: EOG test scores showed little, if any gains, again this year (See below).
For what it’s worth, former Supt. June Atkinson inflated the state’s graduation rate.
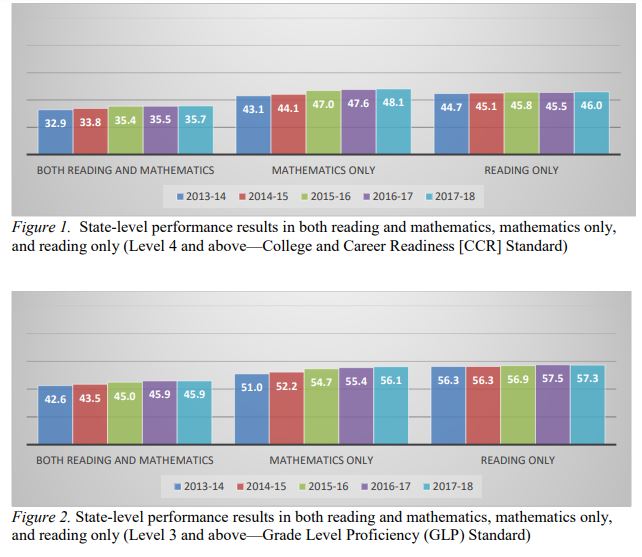
NC DPI spun these scores by comparing them to 2013, which is the year prior to the change in the proficiency scoring scale from a four-point scale to a five-point scale.
Grades k-5 are the years where kids get their foundational skill sets. In particular, K-3 can be considered the critical years. It is this set of grade levels that are being discussed here with a focus on 3rd grade in this article.
All data discussed here can be accessed at the Department of Public Instruction’s Accountability and Reporting page.
The datasets looked at here have abbreviated jargon in them, so here is a key for deciphering that data:
GLP = Grade Level Proficiency
CCR = Career and College Ready
Level 1: Limited Command
Level 2: Partial Command
Level 3: Sufficient Command (Grade-Level Proficiency)
Level 4: Solid Command (Career and College Readiness)
Level 5: Superior Command (Career and College Readiness)
Bear in mind when reviewing the data presented here that several years ago, the State Board of Education and former Superintendent June Atkinson altered the 1-5 scale above by adding a level. This change was made to hide or soften falling test scores following the implementation of Common Core.
The numbers below represent the proficiency rate of all students in NC across all subjects. The initial data is further broken down by various factors like race, disability, and language gap issues.
Click on the chart to make it bigger.
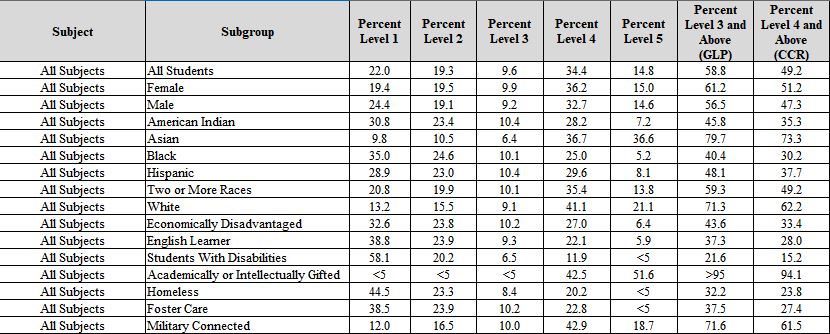
As one can see, less than half of all North Carolina students are “Career and College Ready.” The grade level proficiency (levels 3-5 combined) is 58.8%.
A more accurate reading of actual grade-level proficiency would be to only add level 4 and 5, which means that 49.2% actually grade-level proficient. Alternatively, 51.8% of students are not.
Below are the data sets for Reading in Grade 3, which is the grade that the Read to Achieve program is active in.
Also, bear in mind that the EOG and Read to Achieve tests are Common Core aligned. This is particularly important with regards to reading scores, as the Common Core reading comprehension portion in both 3rd and 4th grades are wildly age-inappropriate.

If one subtracts level 3 out of the GLP total, only 44.9% of kids are reading at grade level and around 34% are career and college ready.
Minority level scores here are abysmal with only 39.1% of black students and only 41.7% of Hispanic students are at grade level in reading. If one backs out the level 3 data, those scores plunge to around 28% and 31% respectively.
Math scores for Grade 3 have higher rates, yet overall are stagnant when compared to the last few years.

What’s not discussed much is the over-testing districts in the state do. Wake County is one of the bigger offenders.
This year, kids in NC are going to get some relief and I laid out a number of testing issues in the tweet thread below. Read the whole thread by clicking the tweet or clicking HERE.
Past Years Articles on the EOG


Pingback: Common Core Is A One-Size-Fits-All Coffin For Education | LL1885
Let’s make it easy. Get rid of Common Core and let teachers teach.
LikeLike