Wake County School Board member, Tom Benton, might be a Common Core math victim. Recently Benton told the News and Observer that per pupil spending was still “behind the 2008 level”:
“When we look at the amount of money per student, we are still behind the 2008 level,” said Wake County school board chairman Tom Benton. “The money from the state government has not kept pace with the growing student population.”
Is that true? What does the Department of Public Instruction’s (DPI) statistics say?
If you strictly go by DPI’s Fast Fact numbers which ignore the 5 year average capital dollars, then yes it would be. What is also lagging is federal dollars. Local dollars, however, are pretty close.
Per DPI, Here’s the statewide per pupil spending in 2008-09:
State: $5,616 (65.9%) Federal: $831 (9.8%) Local: $2,075 (24.3%)
TOTAL: $8,522
Wake county was the largest district with 133,215 students and a per pupil expenditure rate of $8,119, not including the 5 year capital outlay.
Now here’s 2015-16, again per DPI:
State: $5,634 (67.9%) Federal: $635 (7.7%) Local: $2,027 (24.4%)
TOTAL: $8,296
Wake county is the largest district again with 153,488 students and a $8,363 per pupil expenditure, not including the 5 year capital outlay.
It would seem that it’s not the state’s spending per pupil that is really lagging. Wake county has been the largest district in the state for quite some time, yet has continually ranked near the bottom of the districts for per pupil spending.
In the 2014-2015 school, Wake county was 97th out of 115 in per pupil spending. That school year, Wake county spent $8,363 per pupil with a 5 year capital outlay average of $673.87.
That 2014-15 per pupil spending by Wake county, not including the capital outlay, is above the statewide average reported by DPI of $8,296 for 2015-16.
Visit DPI’s statistics for more ranking details: Ranking of Final Average Daily Membership, Per Pupil Expenditures, and Capital Outlay
If one looks at the expenditures per pupil statewide, excluding for child nutrition, we see that we’re past 2008 levels in terms of local percentages with statewide percentages showing increases creeping up to 2008 levels.
In 2008, the local percentage was 23.1 whereas in 2015 it is now 24.4%. See below.
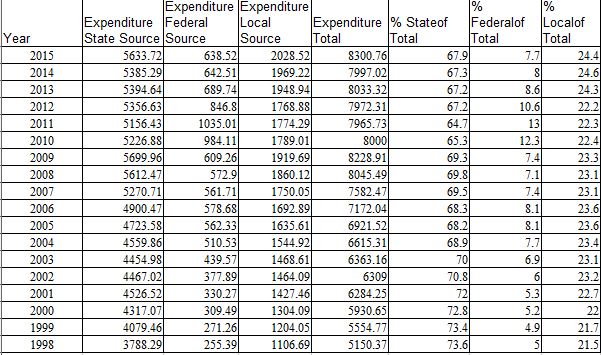
Including child nutrition, the 2008 levels in local percentages stood at 24.4%. In 2015, that funding stood at 24.3%. Mr. Benton is complaining about .1% difference.


You must be logged in to post a comment.